NetSuite 3D Data Museum: Revolutionizing Business Data Visualization
Explore how Three.js can transform NetSuite data into immersive 3D visualizations. See invoices, customers, and transactions come to life in a virtual data museum.
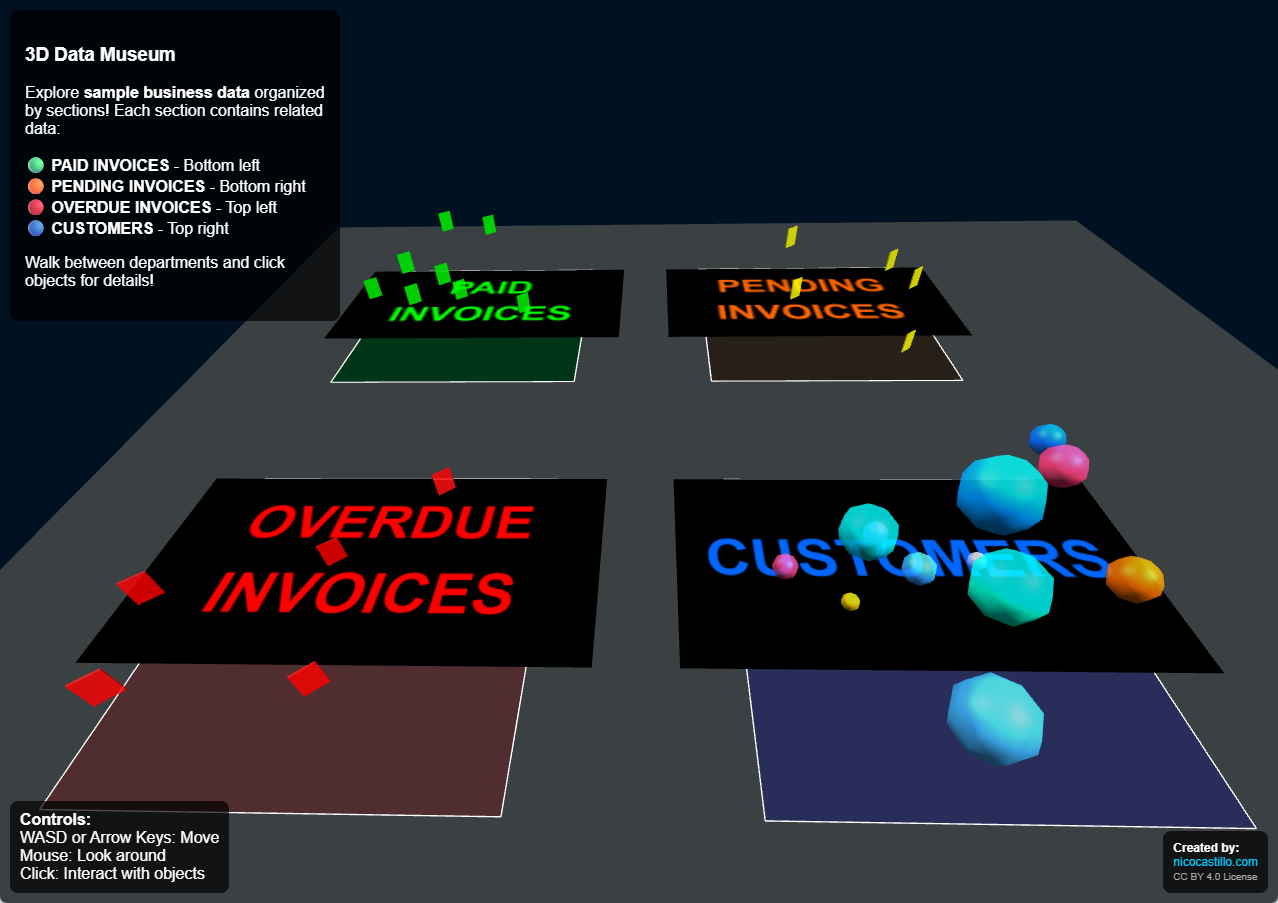
3D NetSuite data Museum
Imagine walking through your NetSuite data like exploring a museum. Picture invoices as floating documents, customers as spheres sized by their transaction volume, and business departments as distinct zones you can navigate through. This isn't science fiction—it's the future of business data visualization, and I've built a proof of concept to show you how.
Why 3D Visualization for NetSuite Data?
Traditional dashboards and reports, while functional, often fail to reveal the spatial relationships and patterns hidden in your business data. When you can walk through your data, you gain intuitive insights that flat charts simply can't provide.
The Power of Spatial Context
- Invoices become 3D objects you can examine from all angles
- Customers are represented as spheres—larger spheres mean more transactions
- Sections are spatial zones with distinct visual identities
- Relationships between data points become immediately visible
Technical Implementation: Three.js Meets NetSuite
This proof of concept demonstrates how Three.js can be integrated into NetSuite customizations to create powerful 3D data experiences.
Core Technologies
// Scene setup
let scene, camera, renderer, controls;
let dataObjects = [];

// Define spatial zones for different data types
const zones = {
    paid: { x: -20, z: -20, width: 18, depth: 18, color: 0x004400 },
    pending: { x: 8, z: -20, width: 18, depth: 18, color: 0x442200 },
    overdue: { x: -20, z: 8, width: 18, depth: 18, color: 0x440000 },
    customers: { x: 8, z: 8, width: 18, depth: 18, color: 0x000044 }
};

// Create scene
scene = new THREE.Scene();
scene.background = new THREE.Color(0x001122);

// Create camera
camera = new THREE.PerspectiveCamera(75, window.innerWidth / window.innerHeight, 0.1, 1000);
camera.position.set(0, 12, 25);

// Create renderer
renderer = new THREE.WebGLRenderer({ antialias: true });
renderer.setSize(window.innerWidth, window.innerHeight);
renderer.shadowMap.enabled = true;
renderer.shadowMap.type = THREE.PCFSoftShadowMap;
document.body.appendChild(renderer.domElement);

// Transform NetSuite data into 3D objects
function createDataObjects() {
    const dataToUse = sampleData;

    dataToUse.forEach((data, index) => {
        let geometry;

        switch(data.type) {
            case 'invoice':
                geometry = new THREE.BoxGeometry(1, 1.5, 0.1);
                break;
            case 'customer':
                // Calculate radius based on transaction count
                const transactionCount = data.transactionCount || data.transactions || 1;
                const radius = minRadius + (normalizedCount * (maxRadius - minRadius));
                geometry = new THREE.SphereGeometry(radius, 8, 6);
                break;
        }

        const material = new THREE.MeshPhongMaterial({
            color: data.color,
            transparent: true,
            opacity: 0.8
        });

        const mesh = new THREE.Mesh(geometry, material);
        mesh.castShadow = true;
        scene.add(mesh);
        dataObjects.push(mesh);
    });
}
Integration with SuiteScript
In a real NetSuite implementation, this could be built as a Suitelet that queries data using SuiteQL:
SELECT
    t.id,
    t.tranid,
    e.entityid AS customer_name,
    t.foreigntotal,
    t.trandate,
    t.status,
    BUILTIN.DF(t.status) AS status_text
FROM
    transaction t
        LEFT JOIN
    entity e ON t.entity = e.id
WHERE
    t.recordtype = 'invoice'
The Suitelet would:
- Query NetSuite records using N/query or N/search
- Transform data into 3D-ready JSON structures
- Serve the visualization through a custom HTML page
Real-World Applications
Executive Dashboards
Imagine C-level executives taking virtual tours of their company's financial health, walking through different departments and instantly seeing problem areas.
Sales Team Visualization
Sales reps could navigate through their customer territories, with larger customer spheres indicating higher-value accounts requiring attention.
Financial Analysis
Accountants could explore invoice aging in 3D space, making overdue payments immediately visible and actionable.
Audit and Compliance
Auditors could walk through transaction flows, following the path of specific invoices or identifying unusual patterns in 3D space.
Warehouse Management
Picture this: walking through your company's warehouses virtually, seeing packages as 3D objects positioned in their actual bins. Each package could be sized by value, colored by priority, and positioned exactly where they exist in the physical world. Warehouse managers could spot bottlenecks, optimize picking routes, and identify inventory imbalances just by taking a virtual stroll through their facilities.
Try the Demo Yourself!
Ready to experience the future of NetSuite data visualization?
Note: This is a proof of concept using sample data for demonstration purposes. The demo showcases the potential of 3D visualization with dummy invoices and customers.
Explore the Source Code
Want to see how it's built? The complete source code for this project is available on GitHub:
The Future of NetSuite Visualization
This proof of concept represents just the beginning. Future enhancements could include:
- Real-time data streams updating the 3D scene as records change
- Real-time actions updating NetSuite data by interacting with the 3D objects
- Predictive analytics showing future trends as 3D projections
- Multi-user collaboration with shared 3D spaces
- VR/AR integration for immersive data analysis
Conclusion
Look, I'll be honest with you—when I first started building this 3D data museum, I wasn't sure if it would actually be useful or just look cool. But after walking through those virtual zones, clicking on floating invoices, and seeing customers as appropriately-sized spheres, something clicked.
This isn't just about making reports prettier. It's about fundamentally changing how we interact with our business data. When you can literally walk up to your biggest customer and see their transaction history floating around them, or stroll through your overdue invoices section and immediately spot the problem areas, you're not just analyzing data—you're experiencing it.
The NetSuite ecosystem is incredibly powerful, but sometimes we get stuck in the same old grids and charts. This proof of concept shows that we can do better. We can create experiences that make data exploration feel natural, collaborative, and dare I say it—actually fun.
Questions or Ideas?
I'd love to hear your thoughts on this project or discuss similar ideas. Always happy to connect with and share experiences.
Start a Conversation